

Figure di Lissajous en
From "Physics, Waves, Music": a website about the physics of waves and sound, acoustics of musical instruments, musical scales, harmony and music.
| AI-translated from Italian. Original page: Figure_di_Lissajous |
Lissajous figures
We do not present Lissajous figures here in their rigorous mathematical definition, but only as a tool for the analysis of oscillatory phenomena.


Suppose we have to study two simple harmonic oscillators and that we have measured experimentally their laws of motion and , which we can plot on two graphs of the type .


If we now want to deduce from these graphs alone the ratio between the frequencies of oscillation and the relative phase shift, without knowing the exact analytical solution in advance, a mere comparison of the two laws of motion can be difficult (see the figure on the left).
A much more effective representation of the properties we want to determine is a diagram in which time does not appear explicitly and the two quantities and are plotted one against the other: at each fixed time we take and , which become, respectively, the abscissa and the ordinate of the points in the new graph. In the particularly simple case of pure harmonic oscillations these curves are called "Lissajous figures" (figure on the right). Lissajous figures are particularly useful because:
- they represent the trajectory actually described by a point whose motion is the superposition of two harmonic motions in perpendicular directions;
- from the Lissajous figures, and this is our aim, it is immediate to determine the ratio between the frequencies when it is a rational number;
- from the Lissajous figures it is also immediate to determine the phase shift between the two oscillators for particularly simple angles (e.g. 30°, 60°, etc.).
Let us illustrate the simple graphical procedure:
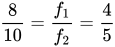
Draw two straight lines parallel to the axes, so that they do not pass through the points where the branches of the curve cross each other. Now count the intersections of these lines with the curve. In our case we have 8 intersections along the line parallel to the axis (red line) and 10 along the line parallel to the axis (green line). The ratio between the number of intersections with the red line and the number with the green line is equal to the ratio between the frequencies of the oscillators and . In this case:


Overview
Some Lissajous figures obtained for simple frequency ratios, keeping the phase shift between the oscillators equal to 0.
| 1:1 | 1:2 | 1:3 | 1:4 |
|---|---|---|---|

|

|

|

|
| 2:1 | 3:1 | 4:1 | |

|

|

|
Some Lissajous figures obtained keeping the frequencies of the oscillators equal and varying their phase shift.
| φ=0° | φ=30° | φ=60° | φ=90° |
|---|---|---|---|
|
|

|

|

|
| φ=180° | φ=150° | φ=120° | |

|

|

|
The only way to distinguish positive from negative phase shifts is to watch how the figures form in time.
| φ=+60° | φ=-60° |
|---|---|

|

|
