

Spettrogramma en
From "Physics, Waves, Music": a website about the physics of waves and sound, acoustics of musical instruments, musical scales, harmony and music.
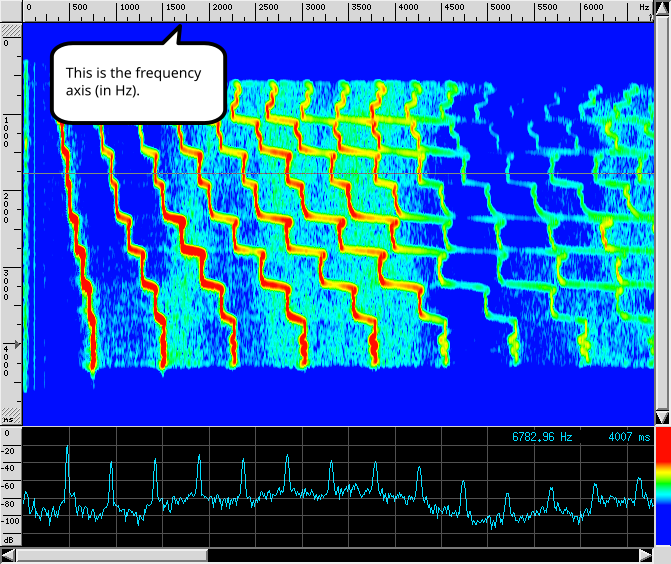
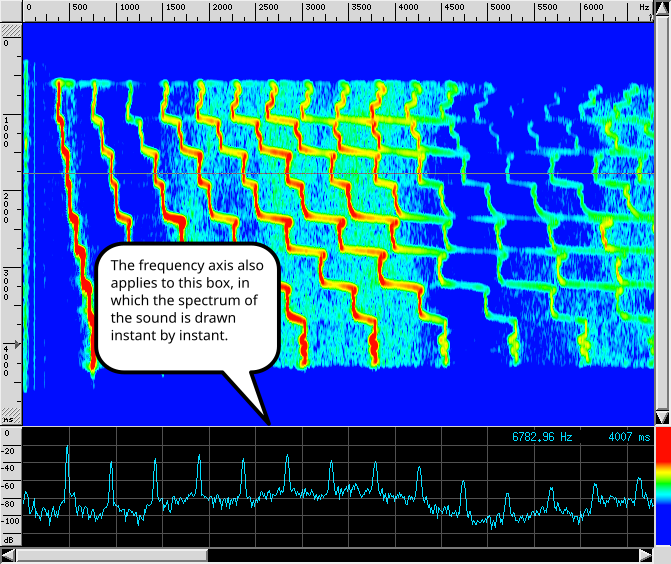
This brief introduction explains how to read the spectrograms (also called sonograms) that can be found on many pages of this website. Some spectrograms are animated, while others are static images. In both cases, the following animation will be helpful in the reading and contains suggestions on the interpretation of the sound spectrum of a signal. For a gallery of spectrograms, look through the drawings or go directly to the pages on musical instruments.
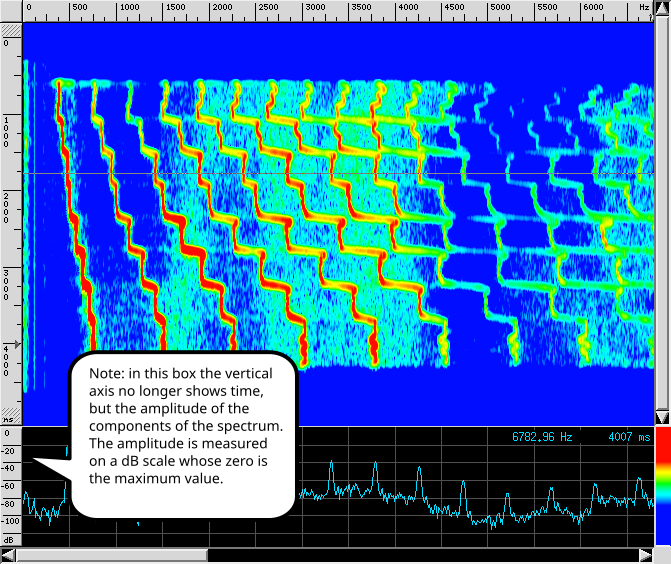
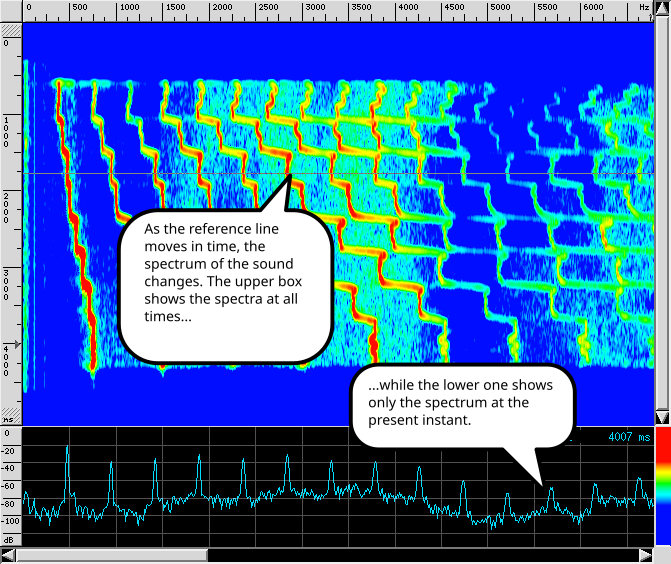
Use the ◀ and ▶ buttons (or the arrow keys after clicking a button) to step through the slideshow. The text of each callout is repeated below the picture.

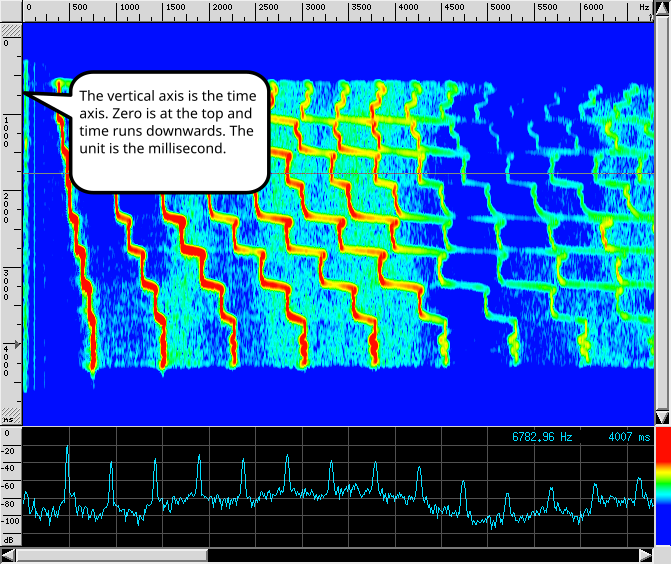
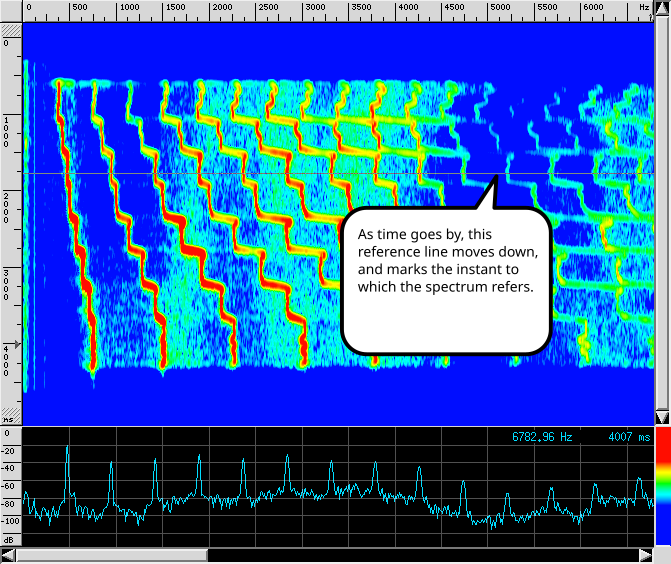
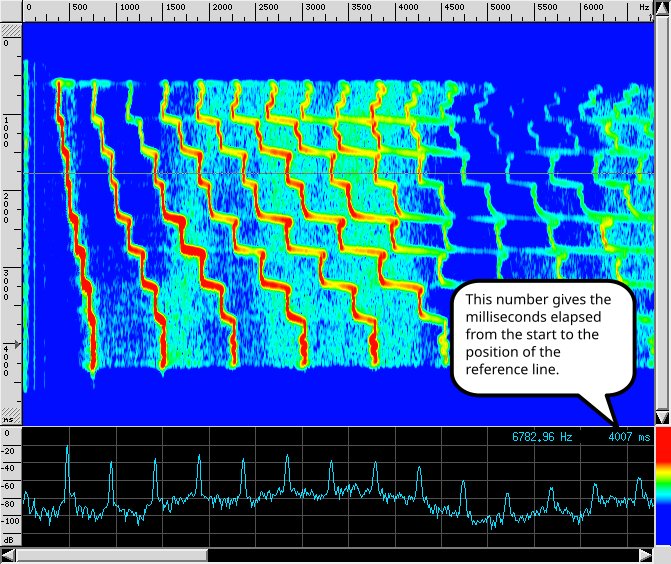
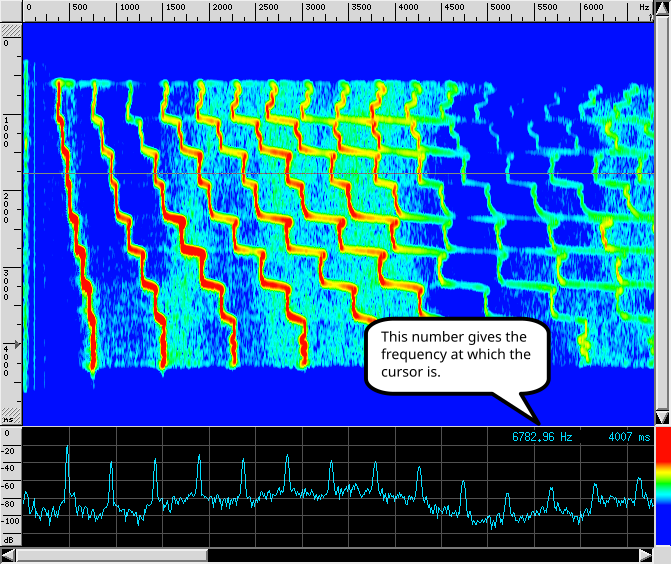
What a spectrogram shows
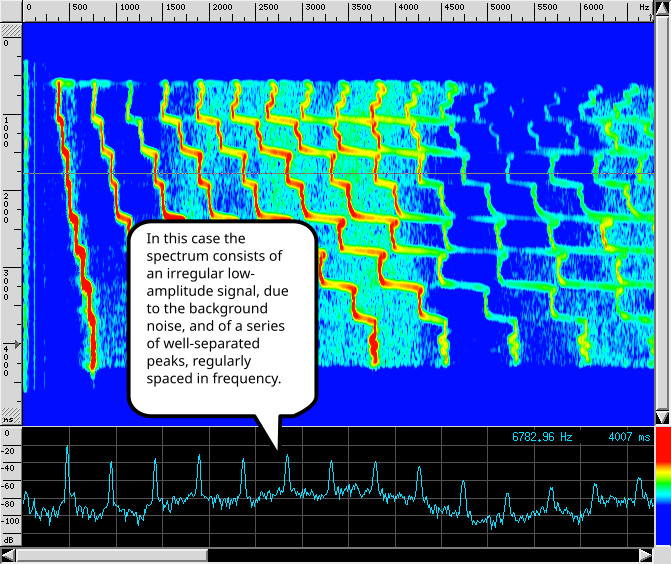
- A periodic sound, such as a note played or sung, contains only frequencies that are multiples of its fundamental frequency (see Fourier's theorem). In the spectrum it therefore appears as a series of equally spaced peaks, and in the spectrogram as a series of lines parallel to the time axis: the frequency distance between two neighbouring lines equals the fundamental frequency, that is, it gives the pitch of the note. For example, peaks at 220, 440, 660 Hz... indicate a note of 220 Hz.
- When the pitch changes, as in the sung scale of the example, all the lines move together and their spacing changes.
- A noise has no distinct lines: its energy is spread over a wide band of frequencies and in the spectrogram it appears as a uniformly coloured area (see Sound or noise?).
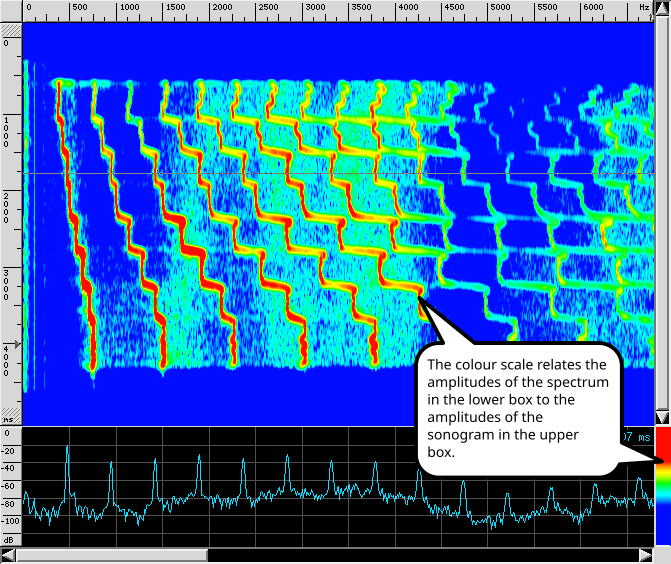
- The colour, or the height of the peaks in the spectrum, shows how strong each component is: the relative amplitudes of the harmonics largely determine the timbre.
The analysis window
To calculate the spectrum of a sound, a program such as Audacity takes a stretch of the signal (the window) of a certain number of samples and calculates its Fourier transform. The result is an average over that stretch. Changing the size or type of the window changes the way the samples are weighted. So the spectrum also changes: it is not an error, they are different measurements. The spectrogram repeats this calculation over successive windows, and the choice of window determines its appearance.
- Resolution in frequency and in time. With the usual sampling rate (44100 samples per second) a window of 512 samples lasts about 12 ms, one of 2048 samples about 46 ms. The shorter window separates frequencies at least a few hundred Hz apart: two peaks at 200 and 400 Hz appear as a single "hill". The longer window separates them well, but follows rapid changes of the sound less well. One resolution cannot be improved without worsening the other (see frequency-time uncertainty). For the voice, windows of a few tens of milliseconds are reasonable.
- Comparisons. To compare different spectra it is best always to use the same window (size and type).
- Sounds that change. The spectrum of a long stretch, such as a whole word, is an average and says nothing about the order in time: a sound and the same sound played backwards have the same amplitude spectrum. To follow the evolution over time you need the spectrogram.
- Negative values in dB. The zero of the scale corresponds to the maximum the system can represent, so a peak at −15 dB is not "inaudible": it is 15 dB below the maximum. The absolute level depends on how the signal was recorded.
- Other algorithms. Autocorrelation, offered by some programs as an alternative to the spectrum, measures something else: how similar the signal is to itself shifted in time. It is useful for estimating the period (and hence the pitch) of a sound, but it does not say which frequencies it contains.
Check your understanding
In the spectrogram of a sung note there are distinct lines at 196, 392, 588 and 784 Hz. What is the fundamental frequency of the note? What would you see instead for the noise of a waterfall?
Answer. The lines are equally spaced, 196 Hz apart, and are the multiples of 196 Hz: the fundamental is 196 Hz (a G). The noise of a waterfall is not periodic and has no distinct lines: its energy is spread over a wide band of frequencies and appears as a uniformly coloured area.You want to separate two components at 200 and 400 Hz in a spectrogram. Is a window of 512 samples or of 2048 samples better? What do you lose with the better choice?
Answer. The 2048-sample window (about 46 ms) is better: the longer the window, the finer the frequency resolution, while with 512 samples (about 12 ms) the two peaks merge. The price is a poorer time resolution: rapid changes of the sound, shorter than the window, can no longer be distinguished.The spectrum calculated over a whole word is the same as that of the same word recorded backwards. Why? How can the two recordings be told apart?
Answer. The amplitude spectrum of a long stretch is an average over the whole stretch: it says which frequencies are present and with what amplitude, but not in what order. The spectrogram, which calculates the spectrum over successive windows, shows the evolution in time and so distinguishes the two recordings.Further reading and links
- Related questions and answers:
