

Il rumore in casa misurato con lo smartphone en
From "Physics, Waves, Music": a website about the physics of waves and sound, acoustics of musical instruments, musical scales, harmony and music.
Measuring the noise of an area properly takes professional sound level meters, which are expensive and must be calibrated, so a single institution can set up only a few measuring stations. Almost everybody, however, carries a smartphone, and a smartphone with the right app can work as a sound level meter. Can thousands of citizens with their smartphones then help to monitor noise pollution? And is the noise they measure related to how comfortable they feel at home?
This page summarises a participatory (or citizen science) experiment, published in PLOS ONE[1], in which about 500 participants, most of them high-school students, measured the noise in their homes with their smartphones and rated how acoustically comfortable they felt.
The experiment
The experiment, called #scienzasulbalcone ("science on the balcony"), was organised by researchers of the CNR (the Italian National Research Council), ARPA Piemonte (the environmental agency of the Piedmont region) and ICS Maugeri, in the autumn of 2020, during the COVID-19 pandemic. It was first presented to a dozen schools of Bergamo during the BergamoScienza festival, on 12–14 October 2020, and then launched nationally on 19 October 2020, during the National Geographic Science Festival in Rome. Data were collected until 15 November 2020. Instructions and teaching materials for teachers and students were published on a dedicated website.
Measuring sound with a smartphone
All participants used the same free app, OpeNoise, developed by ARPA Piemonte for Android and iOS: in this way the sound was processed by the same algorithm on every phone. During one minute the app measures the sound pressure level and gives three numbers:
- LAeq, the equivalent continuous level: the level of a steady sound that would carry the same energy as the measured sound during the whole minute. If is the A-weighted sound pressure, the reference pressure and the duration of the measurement,

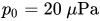


- LAmax and LAmin, the highest and lowest levels reached during the measurement.
The letter A means that the levels are A-weighted: before being added up, the different frequencies of the sound are weighted roughly as the ear does at moderate levels, so that very low and very high frequencies, to which the ear is less sensitive, count less (see the equal-loudness curves). A-weighted levels are written in dB(A), and they are the ones used by noise regulations.
Smartphones, however, are not designed to measure sound: their microphones and electronics are made to record the voice and possibly music, in the cheapest effective way. Laboratory tests found that the best apps can measure within about ±2 dB(A), but each smartphone model needs its own correction (its gain), and a measurement in the field is much harder to control than one in the laboratory. For this reason the participants were asked not to correct the readings of the app: the corrections were applied afterwards, to the phones whose model had been calibrated in the laboratory. The calibration compared each model with a professional (class 1) sound level meter, using pink noise at levels between 50 and 80 dB(A).
What the participants did
Each participant needed a smartphone with OpeNoise, paper and pen. The protocol had three phases:
- Phase I (preparation): getting familiar with the app and becoming aware of the sounds that can be heard at home.
- Phase II ("measuring noise"): measuring the noise from an open window, at different times, and each time rating the acoustic comfort on a scale from 1 (least comfortable) to 5 (most comfortable). At the end, each participant chose two measurements, the noisiest and the quietest situation experienced, and sent them through an online form, together with the time of the measurement, the main source of noise and a few details about the home (type of area, floor, whether the window faced a street or an inner courtyard).
- Phase III (optional, "measuring silence"): measuring the quietest background, in the quietest room of the home, with all the windows shut.
As the Italian rules for measuring noise in homes require, the phone was held about one metre from the open window. Participants were asked to avoid every noise produced inside the home (TV, voices, handling of the phone) and to repeat the measurement if something unexpected happened.
The app does not record sound and does not know where the phone is, and the form asked only for the municipality: the participants remained completely anonymous. The price is that the data cannot be used to draw a noise map, which was not the purpose of the experiment.
The participants and the data
492 records with 1258 measurements arrived from 12 Italian regions out of 20; 91% of them were sent by high-school students aged 14 to 18. 36% of the phones were iPhones, the others were Android phones of various makers, roughly as in the Italian market.
Before the analysis, every record was checked for inconsistencies. Some contained duplicated or impossible data (for instance LAmin greater than LAmax) and were discarded; in 65 records the noisy and quiet measurements had evidently been swapped when filling in the form (the "quiet" one had both the lower comfort rating and the higher level), and were swapped back. In the end 93% of the records were valid: a remarkable result for an experiment carried out by hundreds of people at home, with no supervision.
The results
Comfort
Most homes turned out to be acoustically comfortable: the quiet situations got an average rating of 4.2, and the rating 1 was never used for them. The ratings of the noisy situations were much more varied (average 2.8): ratings 2, 3 and 4 were used about equally often, and even 5 in 4% of the cases. A noisy situation is therefore not necessarily perceived as uncomfortable. The comfort was rated higher at night (3.4 by day, 4.1 at night).
More noise, less comfort: the differences

Even without any calibration, a phone can tell reliably how much a sound is louder than another: its error largely cancels out in the difference between two measurements made with the same phone. Since each participant measured both a noisy and a quiet situation, the authors first studied the differences of level, together with the differences of comfort rating.
When a participant rated the two situations as equally comfortable, the median difference of level was close to 0 dB(A): a good sign that the data are consistent. As the difference in comfort grows, so does the difference in level: on average the level is about 6 dB(A) higher for each point of comfort lost (5.9 dB(A), with a 95% confidence interval from 5.1 to 6.7 dB(A)).
Calibrating the phones: the quietest background

The measurements of Phase III served two purposes: to test the calibration, and to spot phones that behave unexpectedly. A quiet room with the windows shut is the quietest place most of us know, and its level can be predicted fairly well.
After the correction, the iPhones behaved remarkably well: no iPhone measured less than 26 dB(A), and many measurements gathered around 28.6 dB(A). The corrections for different iPhone models agree within ±1 dB, probably thanks to a more standardised production. The Android phones were much more scattered: some measured less than 20 dB(A), or even negative levels, which are impossible in a real room. Either the model had been recognised wrongly (many models share a name and differ only by a suffix such as "Pro" or "Plus"), or the correction depended on the version of the operating system, or these phones simply cannot measure such quiet sounds. Their measurements were discarded, together with all the measurements below 26 dB(A), the lowest level a reliable phone measured in this experiment.
Phase III thus turned out to be a key part of the protocol: a measurement of "silence" reveals the phones whose readings cannot be trusted.
More noise, less comfort: the absolute levels

After calibration, 436 measurements were left. Their median levels were about 49 dB(A) in the noisy situations and 42 dB(A) in the quiet ones.
The median level decreases steadily as the comfort rating grows: it is above 60 dB(A) for the lowest rating and about 39 dB(A) for the highest. On average the level decreases by about 5.6 dB(A) for each point of comfort, very close to the 5.9 dB(A) found from the uncalibrated differences: the two analyses confirm each other.
The trend is clear, but the scatter is large: measurements with the same rating can differ by tens of decibels. Part of the scatter comes from the participants themselves (each person has their own idea of comfort, and follows the instructions more or less carefully), part from the phones: a statistical analysis attributes 29% of the variance to the differences between participants and 28% to the differences between phone models.
Sudden events
A one-minute measurement can be dominated by a single sudden event, such as an ambulance or a dog barking. In this experiment LAeq was very strongly correlated with LAmax, the loudest moment of the minute, while LAmin, the background level, varied more freely. The difference between LAeq and LAmin, which measures how much short loud events stand out, turned out to be smaller in the more comfortable situations: the comfort rating depends not only on the average level, but also on how often disturbing events occur.
A few measurements above 75 dB(A) described clearly exceptional events, explained by the comments of the participants: "heavy renovation work in the neighbour's apartment", "ambulance", "leaf blowing during road cleaning", "heavy traffic on the motorway", "car accident".
Where does the noise come from?

Road traffic was the source mentioned most often (33% of all the measurements), and the main one in the noisy situations (40%), followed by outdoor human activities (21%). In the quiet situations natural sounds came first (35%), before road traffic (27%) and unidentified sources (14%). The sources were ranked in the same order of comfort in both situations: natural sounds were associated with the highest comfort, industrial noise with the lowest.
In both situations about half of the measurements around 46 dB(A) came from road traffic. The quiet situations, however, show a second, sharp peak at about 30 dB(A): it appears only at night and only in places with a low population density, and it is mostly made of background noise from unidentified sources, probably coming from far away (distant roads, factories, human activities). Part of this peak may also be due to the phones themselves, which in practice cannot measure much lower levels.
Are the legal limits reasonable?

The median levels found in the experiment, about 49 and 42 dB(A), are very close to two thresholds of the Italian regulations: according to the decree DPCM 14/11/1997 (see the regulations), if the noise measured inside a home with the windows open does not exceed 50 dB(A) by day and 40 dB(A) at night, it is considered negligible and no further checks are required.
The data can be used to test these thresholds. Around 46 dB(A) the measurements are split about equally between noisy and quiet situations; between 40 and 80 dB(A), the probability that a situation is rated "noisy" grows on average by about one percentage point for each decibel. Among the measurements rated very comfortable (4 or 5), 82% of those made by day were below 50 dB(A), and the curve changes slope clearly at that level: the daytime threshold looks quite adequate. At night only 69% of the very comfortable measurements were below 40 dB(A), and the curve does not change slope there: the night threshold might be less adequate, but the very comfortable night measurements were few (51), so no firm conclusion can be drawn.
Half of the measurements were made after 11 November 2020, when new regional restrictions against the pandemic came into force, but no change was found in the levels or in the comfort ratings: 89% of the measurements were made during the day, mostly in the afternoon, when the restrictions did not limit traffic.
What we learn from the experiment
- A noise measurement campaign carried out by hundreds of citizens, most of them students, all over the country, is feasible, and the data collected were remarkably consistent.
- Even uncalibrated phones give useful information when two measurements made with the same phone are compared: this way alone, the change in noise level could be linked to the change in comfort.
- Absolute levels require a correction for each phone model, and the database of corrections must be kept up to date, as new models keep reaching the market. A measurement of the quietest background (Phase III) reveals the phones whose correction is wrong.
- Most errors were human: values copied from paper to the form by hand, noisy and quiet situations swapped, measurements made during exceptional events instead of ordinary ones. An app that sends the data directly, and a question on whether the situation is a usual one, would avoid most of them.
- The value of participatory experiments does not lie in the accuracy of each measurement, which is limited, but in the possibility of collecting large amounts of data in the field, quickly and cheaply, and of extracting general trends from them. A more detailed description of the sound, for instance through its spectrum, is limited by the phones themselves: without an external microphone they are unreliable below about 250 Hz.
Trying it yourself
You can repeat the measurements of the experiment at home with a smartphone and the free app OpeNoise (Android, iOS). Without a calibration of your phone the absolute levels may be wrong by several decibels, but the differences between two measurements made with the same phone are reliable: try comparing the noisiest and the quietest moments of a day at your window, and the level of your quietest room with the windows shut.
In-depth study and links
- #scienzasulbalcone, the website of the experiment, with the instructions and the teaching materials (in Italian).
- For the decibel scale see sound pressure levels and perception of loudness; for the limits set by law, see acoustic pollution.
References
- ↑ 1,0 1,1 1,2 1,3 1,4 1,5 C. A. Rozzi, F. Frigerio, L. Balletti, S. Mattoni, D. Grasso and J. Fogola, "Indoor noise level measurements and subjective comfort: Feasibility of smartphone-based participatory experiments", PLoS ONE 17, e0262835 (2022), doi:10.1371/journal.pone.0262835 (open access). The figures on this page are taken from the article, under the CC BY 4.0 licence. The data are available at osf.io/nufmx.
